TL;DR: Rebuilt a broken data pipeline and designed a unified analytics platform that let ETF fund sponsors measure advertising ROI for the first time.
Client
Arro Financial Communications
Role
Product Owner, Analytics Lead
Context
Arro is a financial marketing agency advising on multi-channel advertising campaigns for ETF fund sponsors. As the product owner for their analytics and BI platform, I own the full stack — data quality, pipeline architecture, dashboard design, and executive reporting — for a client environment where accuracy and timeliness directly affect investment decisions.
The Problem
The client needed to understand whether their advertising spend was effective and whether it drove fund inflows. The data lived in disconnected silos across Google, Reddit, StockTwits, Benzinga, Bullish, and Cadreon — each platform with different metrics, naming conventions, and reporting cadences. There was no unified view, no way to attribute impact across channels, and no system for measuring ROI at the fund level. Executive reporting was manual, inconsistent, and took days to produce.
Underlying the reporting problem was a data architecture problem. The platform initially relied on GA4’s native BigQuery connector for web traffic data. As the project developed and new data batches arrived, the connector’s API rate limits and inconsistent exports began producing figures that couldn’t be reconciled. Rather than patch individual discrepancies, I redesigned the pipeline from the ground up — a decision that ultimately enabled richer analysis than the original architecture would have allowed.
My Approach
- Audited all data sources across ad platforms and the GA4 pipeline, identifying gaps, inconsistencies, and attribution failures
- Diagnosed the GA4 native connector’s API limit behavior and documented the specific failure modes producing unreliable exports
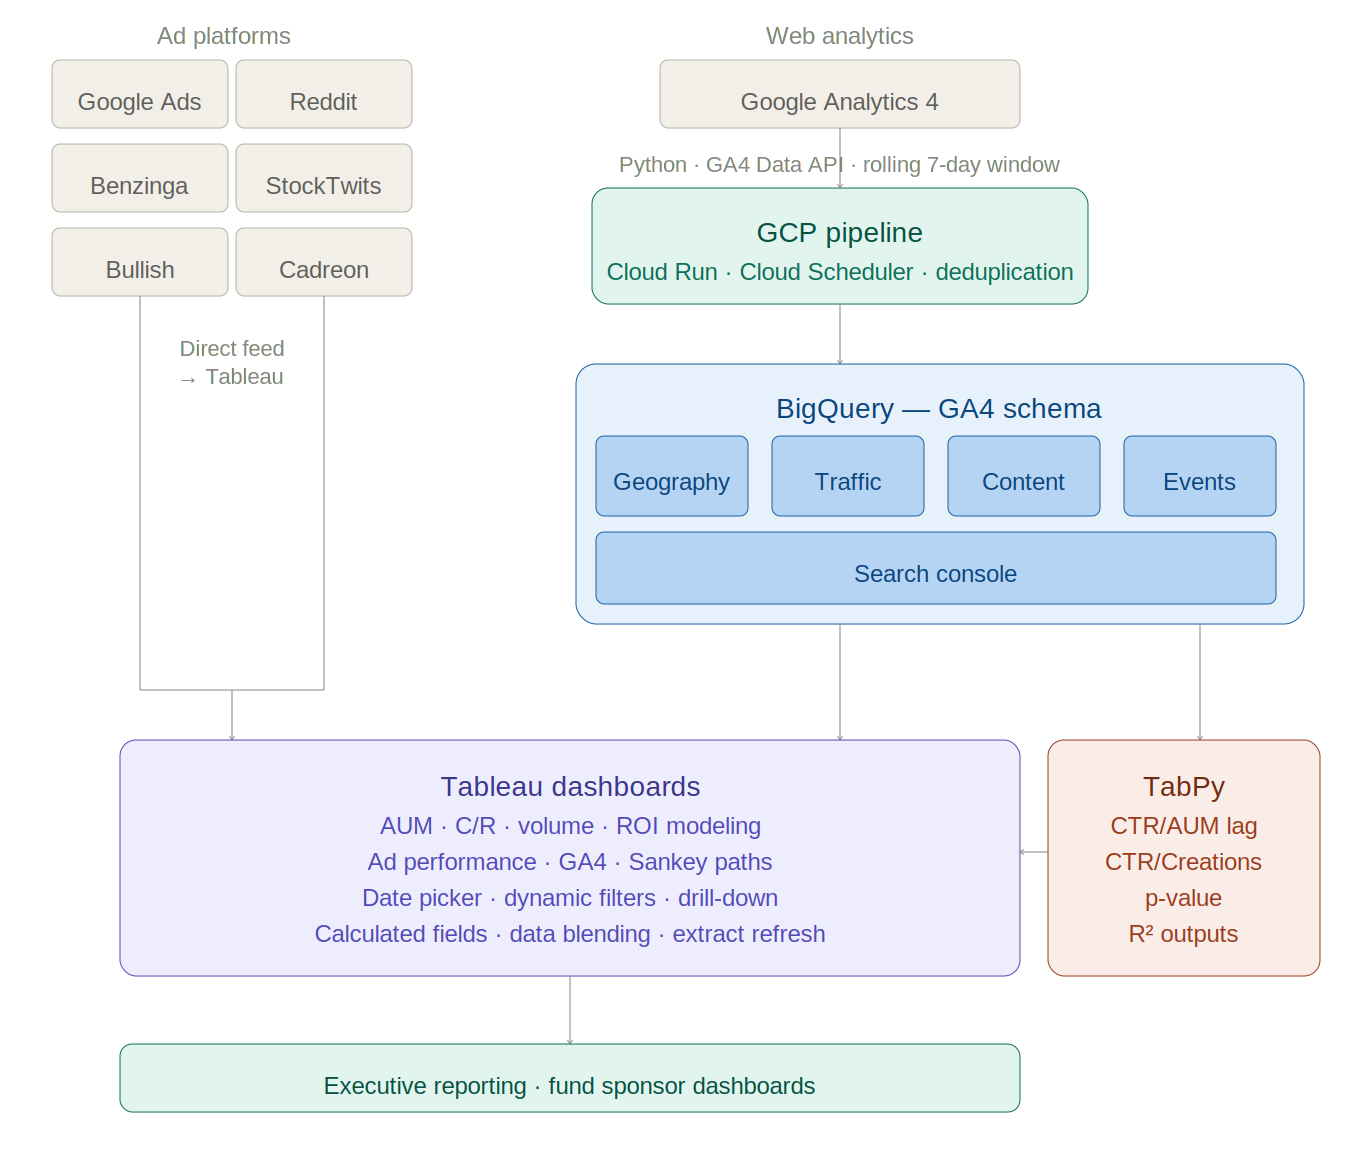
- Designed a new multi-table BigQuery architecture with five dedicated tables — geography, traffic, content, events, and search console performance — built on a richer, more granular dataset than the original, with particular improvements to geographic analysis
- Built a Python-based extraction pipeline using the GA4 Data API directly, with a rolling 7-day window to ensure completeness; containerized in Google Cloud Run with Cloud Scheduler for automated daily execution
- Implemented deduplication logic and append-mode loading to handle re-runs safely; validated data quality across historical and new extracts before cutting over dashboards
- Built calculated fields and data blending logic in Tableau to normalize ad platform metrics across fundamentally different reporting formats — reconciling inconsistent naming conventions, metrics definitions, and reporting cadences across six platforms
- Built calculated fields in Tableau for CPC, CPM, CTR, and fund-level ROI modeling, including creation/redemption correlation with ad spend
- Developed multi-channel performance dashboards covering AUM market share, volume share, and sponsor ROI
- Implemented Sankey diagrams for user path visualization using GA4 and BigQuery session data
- Introduced statistical analysis via TabPy integration for lag-adjusted CTR/AUM and CTR/Creations correlation, with p-value and R-squared outputs to give the client defensible evidence rather than directional intuition
- Established automated extract schedules and data freshness monitoring to ensure reporting accuracy at all times
Outcome
The client now has a unified analytics platform that directly connects campaign activity to fund performance indicators. The rebuilt pipeline has run reliably in production with no data loss or reconciliation issues since launch. Fund sponsors can see — for the first time — which channels drive the highest-quality investor engagement relative to cost. Statistical modeling replaced gut-feel budget decisions with evidence-backed allocation. Executive dashboards eliminated the manual reporting cycle entirely.